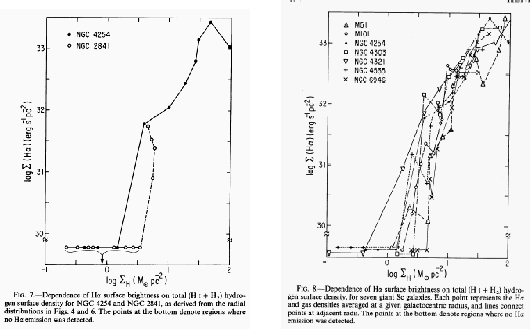
In Figure 3.2 (left), the correlation between star formation rate and gas density
is plotted for specific galaxies (NGC 4254 and NGC 2841).
This shows us that H surface brightness (star formation rate) and the gas column density are
well correlated each other.
Figure 3.2 (left) also indicates that
there seems a critical gas density below which star formation is not observed.
The value of this threshold column density is approximately
 for both
galaxies in Figure 3.2 (left).
The same correlation is seen in other spiral galaxies [Fig.3.2(right)].
Fitting the correlation with a power-law, he obtained
 |
(3.7) |
for the region active in star formation.
Take notice that this power is very close to that of the global Schmidt law [eq.(3.4)]
The threshold surface gas density ranges from 1
 to 10
to 10
 (
(
 ).
Therefore, theory of star formation must explain (1) the Schmidt law (clear correlation between star formation rate
and the gas surface density) above the threshold column density and (2) the fact that there is no evidence for
star formation in the gas deficient region below the threshold column density.
Figure 3.2:
Distributions of
 and
and
 .
(Left:) Relation between
 and
and
 for an Sc galaxy NGC 4254 and an Sb galaxy NGC 2841.
(Right:) Relation between
 and
and
 for various galaxies.
These are taken from Figs.7 and 8 of Kennicutt (1989).
 |
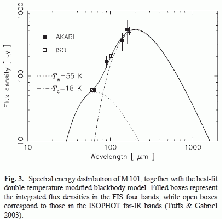
Figure 3.3:
Akari far-IR observation of M101 (Suzuki et al.2007).
(Left) SED of M101.
Dotted and dashed lines represent best-fit modified blackbody spectrum
with
 and
and
 .
.
 |
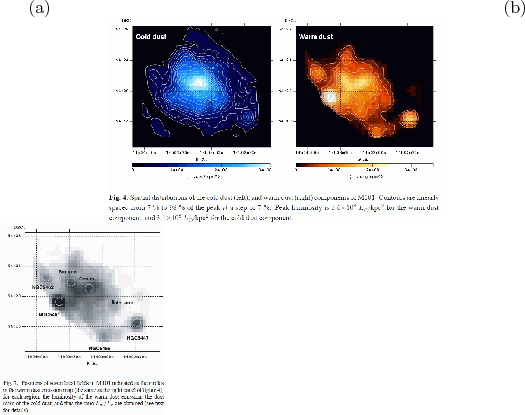
Figure 3.4:
Akari far-IR observation of M101 (Suzuki et al.2007).
(a) Distribution of emissions from cold dust with  (left)
and warm dust with
  (right).
(b) The warm-to-cold intensity ratio is plotted.
 |
Subsections
Kohji Tomisaka
2009-12-10
![]() surface brightness (star formation rate) and the gas column density are
well correlated each other.
Figure 3.2 (left) also indicates that
there seems a critical gas density below which star formation is not observed.
The value of this threshold column density is approximately
surface brightness (star formation rate) and the gas column density are
well correlated each other.
Figure 3.2 (left) also indicates that
there seems a critical gas density below which star formation is not observed.
The value of this threshold column density is approximately
![]() for both
galaxies in Figure 3.2 (left).
The same correlation is seen in other spiral galaxies [Fig.3.2(right)].
Fitting the correlation with a power-law, he obtained
for both
galaxies in Figure 3.2 (left).
The same correlation is seen in other spiral galaxies [Fig.3.2(right)].
Fitting the correlation with a power-law, he obtained


