Next: Equilibria of Cylindrical Cloud Up: Hydrostatic Balance Previous: Problem 2 Contents
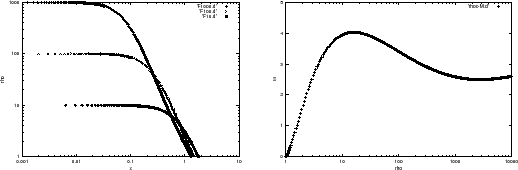
In the preceding section [Fig.4.1 (left)], we have seen the radial density distribution of
a hydrostatic configuration of an isothermal gas.
Consider a circumstance that such kind of cloud is immersed in a low-density medium with a pressure ![]() .
To establish a pressure equilibrium, the pressure at the surface
.
To establish a pressure equilibrium, the pressure at the surface
![]() must equal to
must equal to ![]() .
This means that the density at the surface is constant
.
This means that the density at the surface is constant
![]() .
.
Figure 4.2 (left) shows three models of density distribution,
![]() ,
,
![]() , and
, and ![]() .
Comparing these three models,
it should be noticed that the cloud size (radius) decreases
with increasing the central density
.
Comparing these three models,
it should be noticed that the cloud size (radius) decreases
with increasing the central density ![]() .
The mass of the cloud is obtained by integrating the distribution, which is illustrated against the
central-to-surface density ratio
.
The mass of the cloud is obtained by integrating the distribution, which is illustrated against the
central-to-surface density ratio ![]() in Figure 4.2 (right).
The
in Figure 4.2 (right).
The ![]() -axis represents a normalized mass as
-axis represents a normalized mass as
![]() .
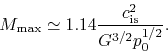
The maximum value of
.
The maximum value of ![]() means
means
Another important result from Figure 4.2 (right) is the stability of an isothermal cloud.
Even for a cloud with
![]() ,
any clouds on the part of
,
any clouds on the part of
![]() are unstable, whose clouds are distributed on the branch
with
are unstable, whose clouds are distributed on the branch
with
![]() .
This is understood as follows:
For a hydrostatic cloud the mass should be expressed with the external pressure and
the central density [Fig.4.2 (right)] as
.
This is understood as follows:
For a hydrostatic cloud the mass should be expressed with the external pressure and
the central density [Fig.4.2 (right)] as
| (4.10) |
| (4.12) |
| (4.14) |
| (4.15) |
On the other hand, the cloud on the part of
![]() (for
(for
![]() ) behaves
) behaves
| (4.16) |
 |
Kohji Tomisaka 2009-12-10