Figure 1.9:
Near infrared images of B335, which is Class 0 source.
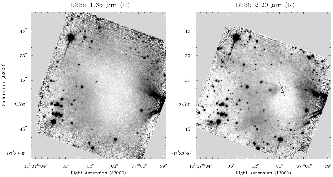 |
Figure 1.10:
Line profile of CS  line radio emission.
Model spectra illustrated in a dashed line (Zhou 1995) are overlaid
on to the observed spectra in a solid line (Zhoug et al 1993).
line radio emission.
Model spectra illustrated in a dashed line (Zhou 1995) are overlaid
on to the observed spectra in a solid line (Zhoug et al 1993).
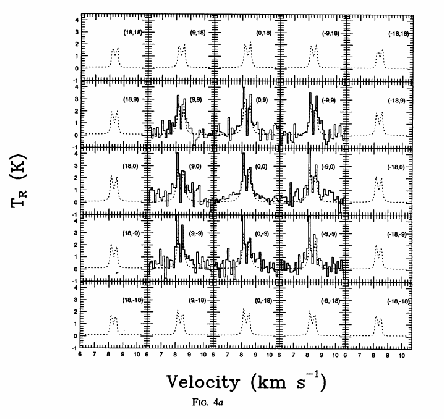 |
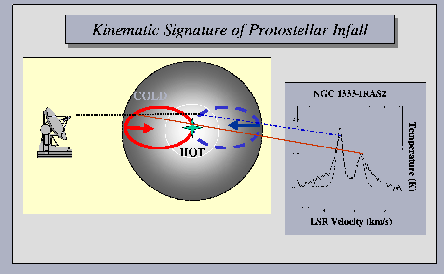
Figure 1.11:
Explanation of blue-red asymmetry when we observe a spherical symmetric inflow motion.
An isovelocity curve for the red-shifted gas is plotted in a solid line.
That for the blue-shifted gas is plotted in a dashed line.
Taken from Fig.14 of Lada (1999).
 |
B335 is a dark cloud (Fig.1.9) with a distance of  pc.
Inside the dark cloud, a Class 0 IR source is found.
The object is famous for the discovery of gas infall motion.
In Figure 1.10, the line profiles of CS line emissions are shown
(Zhou et al. 1993).
The relative position of the profiles correspond to the position of the beam.
(9,9) represents the offset of (9",9") from the center.
At the center (0,0), the spectrum shows two peaks and the blue-shifted peak is brighter than the
red-shifted one.
This is believed to be a sign of gas infall motion.
The blue-red asymmetry is explained as follows:
pc.
Inside the dark cloud, a Class 0 IR source is found.
The object is famous for the discovery of gas infall motion.
In Figure 1.10, the line profiles of CS line emissions are shown
(Zhou et al. 1993).
The relative position of the profiles correspond to the position of the beam.
(9,9) represents the offset of (9",9") from the center.
At the center (0,0), the spectrum shows two peaks and the blue-shifted peak is brighter than the
red-shifted one.
This is believed to be a sign of gas infall motion.
The blue-red asymmetry is explained as follows:
- Considering a spherical symmetric inflow of gas, whose inflow velocity
 increases with
reaching the center (a decreasing function of
increases with
reaching the center (a decreasing function of  )
)
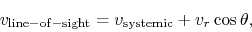
- Considering a gas element at r moving at a speed of
 ,
the velocity projected on a line-of-sight is equal to
,
the velocity projected on a line-of-sight is equal to
 |
(1.5) |
where
 represents the systemic velocity of the cloud
(line-of-sight velocity of the cloud center) and
represents the systemic velocity of the cloud
(line-of-sight velocity of the cloud center) and  is the angle between
the line-of-sight and the position vector of the gas element.
The isovector lines, the line which connect the positions whose procession/recession velocities are
the same, become like an ellipse shown in Fig.1.11.
is the angle between
the line-of-sight and the position vector of the gas element.
The isovector lines, the line which connect the positions whose procession/recession velocities are
the same, become like an ellipse shown in Fig.1.11.
- An isovelocity curve for the red-shifted gas is plotted in a solid line.
That for the blue-shifted gas is plotted in a dashed line.
If the gas is optically thin, the blue-shifted and red-shifted gases contribute equally to the
observed spectrum and the blue- and red-shifted peaks of the emission line should be the same.
- In the case that the gas has a finite optical depth,
for the red-shifted emission line a cold gas in the fore side absorbs effectively the emission
coming from the hot interior.
On the other hand, for the blue-shifted emission line,
the emission made by the hot interior gas escapes from the cloud without absorbed by the cold
gas (there is no cold blue-shifted gas).
- As a result, the blue peak of the emission line becomes more prominent than that of the red-shifted
emission.
This is the explanation of the blue-red asymmetry.
In Figure 1.10, model spectra calculated with the Sobolev
approximation or LVG (large-velocity gradient; Zhou 1995) are shown.
These show the blue-red asymmetry (the blue line  the red line).
Figure 1.12:
C O total column density map (left) and
H
O total column density map (left) and
H CO
CO channel map (right) of B335 along with the position-velocity maps along the
major and minor axes.
Taken from Fig.3 of Saito et al (1999).
channel map (right) of B335 along with the position-velocity maps along the
major and minor axes.
Taken from Fig.3 of Saito et al (1999).
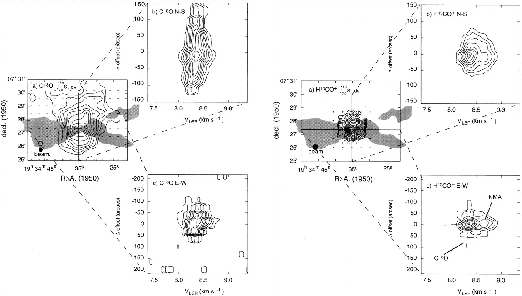 |
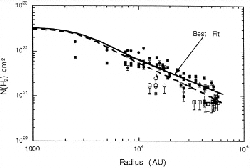
Figure 1.13:
Column density distribution  derived from the HCO and CO
data taken by the Nobeyama 45 m telescope.
Taken from Fig.9 of Saito et al (1999).
derived from the HCO and CO
data taken by the Nobeyama 45 m telescope.
Taken from Fig.9 of Saito et al (1999).
 |
Early observation of star forming regions have revieled
fast molecular outflow are often ejected from the central protostar
with
 .
B335 is also a typical outflow source.
In Figure 1.12, distributions of high density gases traced by
the CO and HCO lines are shown as well as
the bipolar outflow whose outline is indicated by a shadow (Hirano et al 1988).
Comparing left and right panels, it is shown that the distribution of CO gas is more extended
than that of HCO which traces higher-density gas.
And the distribution of the HCO is more compact and the projected surface density
seems to show the the actual distribution is spherical.
And the molecular outflow seems to be ejected in the direction of the minor axis of the high-density gas.
It may suggest that (1) a molecular outflow is focused or collimated by the effect of density distribution
or that (2) collimation is made by the magnetic fields which run preferentially perpendicularly to
the gas disk. This gas disk is observed by these high density tracers.
.
B335 is also a typical outflow source.
In Figure 1.12, distributions of high density gases traced by
the CO and HCO lines are shown as well as
the bipolar outflow whose outline is indicated by a shadow (Hirano et al 1988).
Comparing left and right panels, it is shown that the distribution of CO gas is more extended
than that of HCO which traces higher-density gas.
And the distribution of the HCO is more compact and the projected surface density
seems to show the the actual distribution is spherical.
And the molecular outflow seems to be ejected in the direction of the minor axis of the high-density gas.
It may suggest that (1) a molecular outflow is focused or collimated by the effect of density distribution
or that (2) collimation is made by the magnetic fields which run preferentially perpendicularly to
the gas disk. This gas disk is observed by these high density tracers.
Combining the CO and HCO distributions,
the surface density distribution along the major axis is obtained by Saito et al (1999).
From the lower panel of Figure 1.13,
the column density distribution is well fitted in the range from 7,000 to 42,000 AU in radius,
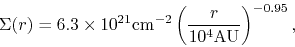 |
(1.6) |
where they omitted the data of
 since the beam size is not
negligible.
Similar power-law density distributions are found by the far IR thermal dust emission.
since the beam size is not
negligible.
Similar power-law density distributions are found by the far IR thermal dust emission.
Kohji Tomisaka
2009-12-10