Next: Premain-sequence Evolution Up: Main Accretion Phase Previous: Before Deuterium Ignition Contents
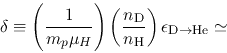
One gram of interstellar matter generates energy by the reaction
of
![]() as
as
 |
(4.119) |
 |
(4.120) |
Entropy inversion
![]() is unstable for the convection
(see
is unstable for the convection
(see ![]() 2.7 in p.
2.7 in p.![[*]](crossref.png) ).
Convection is generated in the region of
).
Convection is generated in the region of
![]() .
Convective motion transfers the energy and the entropy.
The specific entropy peak generated by the Deuterium burning
is smoothed out by the convection.
The convection induced with the Deuterium burning brings a fresh gas
containing Deuterium into the hot Deuterium burning region.
Thus, although the consent of Deuterium is small and Deuterium burning
could not continue long, Deuterium burning continues actually
as long as the convection
can mix the outer Deuterium rich fresh gas into the burning region
due to the convection.
.
Convective motion transfers the energy and the entropy.
The specific entropy peak generated by the Deuterium burning
is smoothed out by the convection.
The convection induced with the Deuterium burning brings a fresh gas
containing Deuterium into the hot Deuterium burning region.
Thus, although the consent of Deuterium is small and Deuterium burning
could not continue long, Deuterium burning continues actually
as long as the convection
can mix the outer Deuterium rich fresh gas into the burning region
due to the convection.
 |
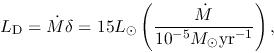
In Figure 4.22, luminosities in protostars accreting at
![]() (left) and
(left) and
![]() (right) are plotted
(Palla & Stahler 1993).
(right) are plotted
(Palla & Stahler 1993).
![]() represents the maximum luminosity transferable radiatively
for a star with mass
represents the maximum luminosity transferable radiatively
for a star with mass ![]() and radius
and radius ![]() as
as
| (4.121) |
| (4.122) |
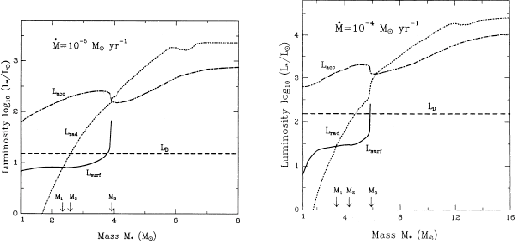
Figure 4.23 (left) illustrates how
the Deuterium burning in protostars evolves.
Accumulating infalling gas and increasing ![]() , the structure of protostars
is changed.
(a) in low-mass stars, convection feeds the Deuterium of the accreting matter
to the burning center.
(b) as increasing the mass and thus the temperature, the opacity of the
stellar interior decreases.
Finally a radiative zone appears and it prevents from mixing Deuterium.
(c) as a consequence, central Deuterium is depleted and energy generation
rate is reduced. Thus the central region becomes radiative.
(d) For higher mass stars, Deuterium ignites as a shell source just
outside the radiative central region.
Due to this Deuterium shell burning,
which is similar to the Hydrogen shell burning in the red giants,
radius of the protostar expands.
Figure 4.23 (right) plots the mass-radius relation
of a protostar with accretion rate of
, the structure of protostars
is changed.
(a) in low-mass stars, convection feeds the Deuterium of the accreting matter
to the burning center.
(b) as increasing the mass and thus the temperature, the opacity of the
stellar interior decreases.
Finally a radiative zone appears and it prevents from mixing Deuterium.
(c) as a consequence, central Deuterium is depleted and energy generation
rate is reduced. Thus the central region becomes radiative.
(d) For higher mass stars, Deuterium ignites as a shell source just
outside the radiative central region.
Due to this Deuterium shell burning,
which is similar to the Hydrogen shell burning in the red giants,
radius of the protostar expands.
Figure 4.23 (right) plots the mass-radius relation
of a protostar with accretion rate of
![]() .
The left open circle represents the beginning of central Deuterium burning
(state a).
On the second circle, radiative barrier appears (state b) and Deuterium shell
burning begins.
Beyond the mass, the radius swells dramatically.
Further increase in the mass increases the gravity and the radius shrinks.
At the third open circle, Hydrogen begins to burn at the center
of the protostar.
.
The left open circle represents the beginning of central Deuterium burning
(state a).
On the second circle, radiative barrier appears (state b) and Deuterium shell
burning begins.
Beyond the mass, the radius swells dramatically.
Further increase in the mass increases the gravity and the radius shrinks.
At the third open circle, Hydrogen begins to burn at the center
of the protostar.
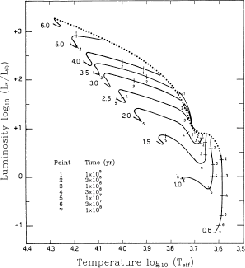
In the HR diagram, the mass-radius relation for the protostars shown
in Figure 4.23(right) corresponds to the dotted line
(Fig.4.24).
Observed premain-sequence stars: T Tauri stars (
![]() )
and Herbig Ae/Be stars (
)
and Herbig Ae/Be stars (
![]() )
distribute below the dotted line.
Thus, this line is often called the birth line for stars.
In Figure 4.24, evolutionary tracks without mass accretion
)
distribute below the dotted line.
Thus, this line is often called the birth line for stars.
In Figure 4.24, evolutionary tracks without mass accretion
![]() are plotted from the birth line.
Modulation of the birth line is related to the swell and shrink of
radius shown in Figure 4.23.
That is, increase of luminosity around
are plotted from the birth line.
Modulation of the birth line is related to the swell and shrink of
radius shown in Figure 4.23.
That is, increase of luminosity around
![]() corresponds to
the first swell after Deuterium burning begins (between the first and second
open circles).
Another increase around
corresponds to
the first swell after Deuterium burning begins (between the first and second
open circles).
Another increase around
![]() is related to the Deuterium
shell burning (after the second open circle).
is related to the Deuterium
shell burning (after the second open circle).
 |
 |