Figures 1.19 and 1.20
show that the outflow found in globule CB 26 is rotating.
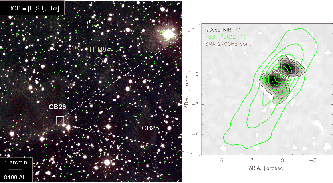
CB 26 is a Bok globule with bipolar NIR refrection
nebulae between which a very young T Tauri star and
 AU-scale high-density disk are observed
(Fig.1.19).
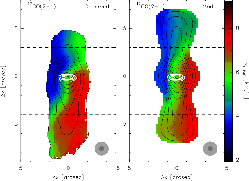
Figure 1.20 shows the map of intensity-weighted velocity
(1st moment)
 |
(1.7) |
where  represents the brightness temperature
for line-of-sight velocity
  .
Left panel indicates clearly that the right part gas is departing
from us while the left part is arriving.
This means there exists a global volocity gradient perpendicular to the
flow axis, or in other words, the rotation motion
in which the rotation axis coincides with the symmetric axis.
The rotation is toward the same direction of the high-density
disk observed by
  CO (Launhardt & Sargent 2001).
Right panel is an expecting intensity-weighted velocity distribution
for a simple model
  CO (
CO ( ),
),
 |
 |
 |
(1.8) |
 |
 |
 |
(1.9) |
 |
 |
 |
(1.10) |
 |
 |
 |
(1.11) |
in which we assume
(i) the outflow is conical,
(ii) gas element at  in cylindrical
coordinate was launched from a Keplerlian disk at
  conserving angular momentum,
(iii) the radial expanding speed
  is
simply proportional to the distance from the central star
  (eq.[1.8]).
The assumption (ii) leads to (eq.[1.9) as
the rotation speed is inversely proportional to the
distance from the rotation axis
 .
(iv) Density and temperature distributions are assumed as
the density decreases with the distance
  in proportion to
  (eq.[1.10]),
and the kinetic temperature decreases with the distance
  in proportion to
  (eq.[1.10]).
Comparing with a simple model (right panel),
such global rotation motion is seen evidently only when
the outflow is observed from edge-on.
Figure 1.19:
Globule CB 26 has an outflow which seems to be seen edge-on.
Grey-scale indicates the K-band image of the bipolar refrection nebula.
Red contours which show SMA 1.1 mm dust continuum emission indicate a
high-density disk exists between two lobes of the bipolar nebula.
Green contours represent the  CO(
CO( ) integrated intensity.
 |
Figure 1.20:
Intensity weighted velocity is shown (left).
Right one is a model.
 |
Kohji Tomisaka
2012-10-03
![]() AU-scale high-density disk are observed
(Fig.1.19).
Figure 1.20 shows the map of intensity-weighted velocity
(1st moment)
AU-scale high-density disk are observed
(Fig.1.19).
Figure 1.20 shows the map of intensity-weighted velocity
(1st moment)
