Next: T Tauri Disks Up: Magnetic Fields Previous: Bok Globules Contents
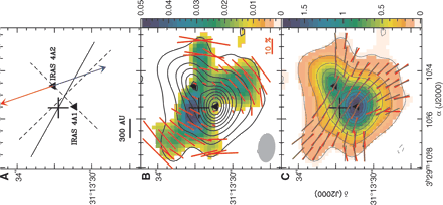 |
Single dish observation with JCMT can reveal a structure larger than 5000-10000AU (Fig.1.23). Smaler-scale configuration of magnetic field is able to be reached with interferometric observation such as SMA. Figure 1.24 indicates a 1000 AU-scale configuration of magnetic field for a low-mass star forming region NGS 1333 IRAS 4A (Girart, Rao & Marrone 2006). Although this is a complex region, a core extends from the upper-left to the lowe-right. The magnetic field (Fig.1.24(right)) runs from the upper-right to the lower-left and this clearly shows 'hour-glass' shape. This means that the magnetic field is squeezed by the effect of contraction in the star formation process.
They fitted the magnetic field line by a polynomial as
| (1.12) |
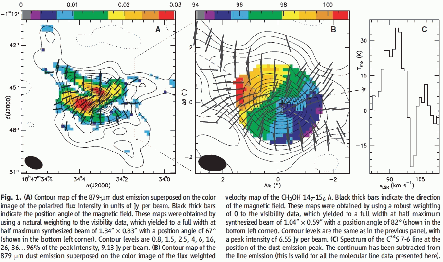 |
SMA observation for G31.41+0.31
(Fig. 1.25) also reviels
that the magnetic field configuration of ![]() AU scale for
high-mass star forming region is ``hour-glass'' shape (Girart et al. 2009).
This may indicate the magnetic field is draged by the infall motion.
However, this can not be fitted with the configuration of the
magnetic field line obtained with single dish observations,
since Fourier component with the small wave-number
AU scale for
high-mass star forming region is ``hour-glass'' shape (Girart et al. 2009).
This may indicate the magnetic field is draged by the infall motion.
However, this can not be fitted with the configuration of the
magnetic field line obtained with single dish observations,
since Fourier component with the small wave-number ![]() is not
sufficiently picked up in the interferometric observation.
In other words, large-scale (more or less uniform) magnetic field
is underestimated in the interferometric observations.
is not
sufficiently picked up in the interferometric observation.
In other words, large-scale (more or less uniform) magnetic field
is underestimated in the interferometric observations.