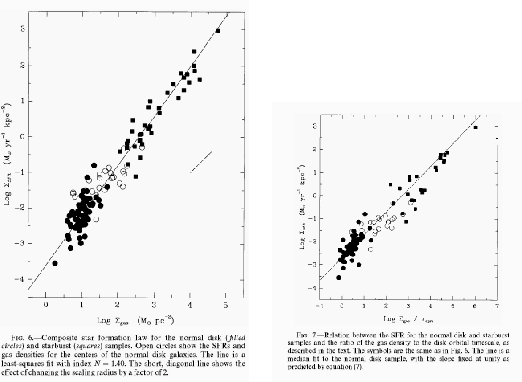
Figure 3.1:
Taken from Figs.6 and 7 of Kennicutt (1998).
Left: The  -axis means the total (HI+H
 ) gas density and the
  -axis does the global star formation rate.
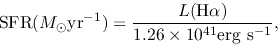
Right: The -axis means the total (HI+H) gas density divided by the orbital time-scale.
The -axis is the same.
-axis does the global star formation rate.
Right: The -axis means the total (HI+H) gas density divided by the orbital time-scale.
The -axis is the same.
 |
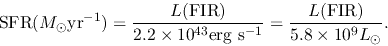
The star formation rate is estimated by the intensity of H emission
(Kennicutt, Tamblyn, & Congdon 1994) as
emission
(Kennicutt, Tamblyn, & Congdon 1994) as
 |
(3.2) |
which is used for normal galaxies.
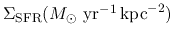
While in the starburst galaxies which show much larger star formation rate than the normal galaxies,
FIR luminosity seems a better indicator of star formation rate
 |
(3.3) |
Kennicutt (1998) summarized the relation between SFRs and the surface gas densities [Fig.3.1 (left)]
for 61 normal spiral and 36 infrared-selected starburst galaxies.
As seen in Figure 3.1,
the star formation rate averaged over a galaxy (
 ),
which is called the global star formation rate,
is well correlated to the average gas surface density
),
which is called the global star formation rate,
is well correlated to the average gas surface density
 .
He gave the power of the global Schmidt law as
.
He gave the power of the global Schmidt law as
 .
That is,
.
That is,
 |
(3.4) |
The fact that the power is not far from 3/2 seems to be explained as follows:
Star formation rate should be proportional to the gas density (
 ) but it should also be inversely proportional to the
time scale of forming stars in respective gas clouds, which is essentially the free-fall time scale.
Remember the fact that the free-fall time given in equation (2.26) is proportional to
) but it should also be inversely proportional to the
time scale of forming stars in respective gas clouds, which is essentially the free-fall time scale.
Remember the fact that the free-fall time given in equation (2.26) is proportional to
 .
Therefore
.
Therefore
 |
(3.5) |
where
 and
and
 are the volume densities of gas and star formation.
He found another correlation between a quantity of gas surface density divided by the
orbital period of galactic rotation and the star formation rate [Fig.3.1 (right)].
Although the actual slope is equal to 0.9 instead of 1,
the correlation in Fig.3.1(right) is well expressed as
 |
(3.6) |
where
 represents the angular speed of galactic rotation.
This means that 21 % of the gas mass is processed to form stars per orbit.
These two correlations [eqs. (3.4) and (3.6)]
implicitly ask another relation of
represents the angular speed of galactic rotation.
This means that 21 % of the gas mass is processed to form stars per orbit.
These two correlations [eqs. (3.4) and (3.6)]
implicitly ask another relation of
 .
.
Kohji Tomisaka
2012-10-03