next up previous contents
Next: Isothermal Phase Up: Local Star Formation Process Previous: Entrainment Model   Contents

Evolution to Star

Figure 4.12: (Left) Relation between density and temperature at the center of the cloud. (Right) Cooling and heating rates, which are calculated for the cloud center are plotted against the density.
\begin{figure}\centering\leavevmode
\epsfxsize =.45\columnwidth \epsfbox{eps/ma...
...}\hfil \epsfxsize =.45\columnwidth \epsfbox{eps/masunaga-heating.ps}\end{figure}
Figure 4.13: Dynamical evolution of a spherical cloud studied with RHD simulation. Density (left) and temperature (right) distributions are plotted against the radius.
\begin{figure}\centering\leavevmode
\epsfxsize =.45\columnwidth \epsfbox{eps/ma...
...s}\hfil \epsfxsize =.45\columnwidth \epsfbox{eps/masunaga-evol-T.ps}\end{figure}

In the proceeding sections we have seen the evolution from gas cloud to stars. However we were restricted to the isothermal gasses. To understand the change in the temperature, we have to consider the radiation which keeps the gas isothermal. Spherical symmetric radiative hydrodynamical simulations have been studied to understand the evolutionary path from interstellar cloud to star. 
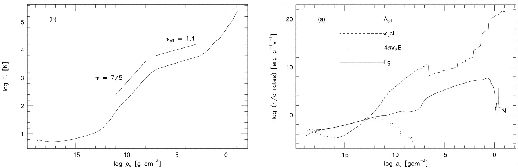
Figure 4.12 (left) illustrates the relation between $\rho$ and $T$ obtained by Masunaga & Inutsuka (2000). Several characteristic power-laws are seen in the figure. 
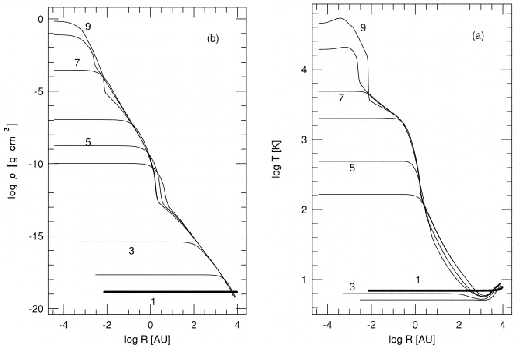
Figure 4.13 plots the density and temperature distribution.


Subsections
next up previous contents
Next: Isothermal Phase Up: Local Star Formation Process Previous: Entrainment Model   Contents
Kohji Tomisaka 2007-07-08