

Next: Problem
Up: Local Star Formation Process
Previous: Protostellar Evolution of Supercritical
Contents
Accretion Rate
Using equation (2.26), the necessary time for a mass-shell at  to reach the center
(free-fall time) is expressed as
 |
(4.83) |
(for detail of this section see Ogino, Tomisaka, & Nakamura 1999).
Consider two shells whose initial radii are  and
and  .
The time difference for these two shells to reach the center
  can be written down using equation (4.83) as
![\begin{displaymath}
\Delta T(R)
=\frac{\pi{R}^{1/2}}{2^{3/2}(GM(R))^{1/2}}
\left[\frac{3}{2}-\frac{{R}}{2M(R)}\frac{dM(R)}{dR}\right]\Delta R.
\end{displaymath}](img1181.png) |
(4.84) |
Mass in the shell between  and
and  ,
,

 , accretes
on the central object in
  .
Thus, mass accretion rate for a pressure-free cloud is expressed
as
 .
This leads to the expression as
 |
(4.85) |
Figure 4.9:
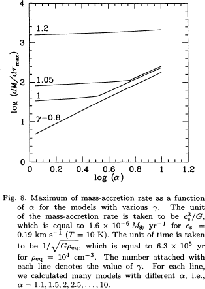
Mass accretion rate against the typical density of the cloud.
 |
This gives time variation of the accretion rate.
Consider two clouds with the same density distribution
 but different absolute value.
Since these two clouds have the same
 ,
the mass accretion rate depends only on
  , and is expressed as
 |
(4.86) |
This indicates that the accretion rate is proportional to  ,
while the time scale is to
  .
This is confirmed by hydrodynamical simulations of spherical symmetric isothermal clouds (Ogino et al.1999).
When the initial density distribution is the SIS as
 ,
the mass included inside
  is proportional to radius
 .
In this case, equation (4.85) gives a constant accretion rate in time.
In Figure 4.9 we plot the mass accretion rate against the
cloud density.
 represents the cloud density relative to that of a hydrostatic Bonnor-Ebert sphere.
This shows clearly that the mass accretion rate is proportional to
  for massive clouds
 .
This is natural since the assumption of pressure-less is valid only for a massive cloud in which
the gravity force is predominant against the pressure force.
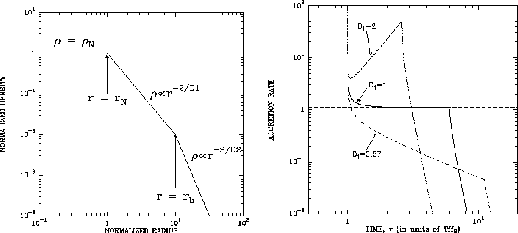
Similar discussion has been done by Henriksen, André, & Bontemps (1997) to explain
a decline in the accretion rate from Class 0 to Class I IR objects.
They assumed initial density distribution of
 |
|
|
(4.87) |
as shown in Figure 4.10.
Since the free-fall-time of the gas contained in the inner core  is the same,
such gas reaches the center once.
It makes a very large accretion rate at
 as
as
 .
If
.
If  ,
,
 for
for
 .
Since
  and
and
 ,
equation (4.85) predicts
 .
A constant accretion rate is expected for this power-law and
the accretion rate is converged to a constant value after
the stellar mass is much larger than than that was containd in
  ,
,
 .
If
.
If  ,
,
 for
for
 .
Since for this power
  and
and
 ,
equation(4.85) predicts
 .
They gave
 for
for  .
.
Figure 4.10:
A model proposed to explain time variation in accretion rate
by Henriksen, André, & Bontemps (1997).
The density distribution  at
at  (left) and expected accretion rate (right).
 |
Subsections


Next: Problem
Up: Local Star Formation Process
Previous: Protostellar Evolution of Supercritical
Contents
Kohji Tomisaka
2007-11-02
![]() to reach the center
(free-fall time) is expressed as
to reach the center
(free-fall time) is expressed as
![]() and
and ![]() .
The time difference for these two shells to reach the center
.
The time difference for these two shells to reach the center ![]() can be written down using equation (4.83) as
can be written down using equation (4.83) as
![\begin{displaymath}
\Delta T(R)
=\frac{\pi{R}^{1/2}}{2^{3/2}(GM(R))^{1/2}}
\left[\frac{3}{2}-\frac{{R}}{2M(R)}\frac{dM(R)}{dR}\right]\Delta R.
\end{displaymath}](img1181.png)
![]() but different absolute value.
Since these two clouds have the same
but different absolute value.
Since these two clouds have the same
![]() ,
the mass accretion rate depends only on
,
the mass accretion rate depends only on ![]() , and is expressed as
, and is expressed as

