 |
 |
 |
In the proceeding sections we have seen the evolution from gas cloud to stars.
However we were restricted to the isothermal gasses.
To understand the change in the temperature,
we have to consider the radiation which keeps the gas isothermal.
Spherical symmetric radiative hydrodynamical simulations have been studied
to understand the evolutionary path from interstellar cloud to star.
Figure 4.13 (left) illustrates the relation between ![]() and
and ![]() obtained by Masunaga & Inutsuka (2000).
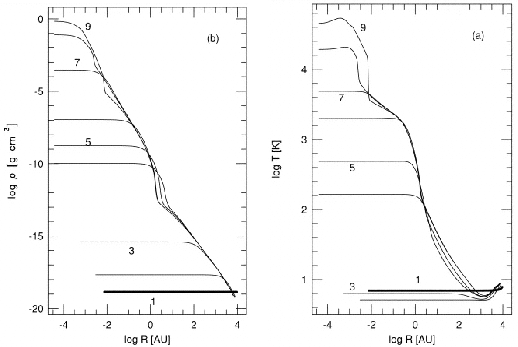
Several characteristic power-laws are seen in the figure.
Figure 4.14 plots the density and temperature distribution.
obtained by Masunaga & Inutsuka (2000).
Several characteristic power-laws are seen in the figure.
Figure 4.14 plots the density and temperature distribution.