Next: Gravitational Instability of Rotating Up: Galactic Scale Star Formation Previous: Star Formation Seen with Contents
We believe that stars form in molecular clouds, in which major component
of Hydrogen is ``molecule.''
![]() is larger than
is larger than ![]() and
H
and
H![]() gas distributes rather uniformly than H
gas distributes rather uniformly than H![]() gas.
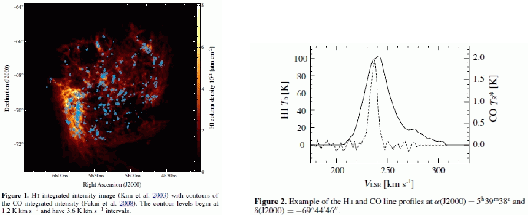
Figure 3.5(a) shows distributions integrated
intensities of H
gas.
Figure 3.5(a) shows distributions integrated
intensities of H![]() (red) and CO (blue) for Large Magellanic Cloud
(Fukui et al. 2009).
CO gas is found as GMCs with a mass
(red) and CO (blue) for Large Magellanic Cloud
(Fukui et al. 2009).
CO gas is found as GMCs with a mass
![]() , while
HI gas is distributed more uniform than that of CO gas.
, while
HI gas is distributed more uniform than that of CO gas.
Figure 3.5(b) shows that line width of HI is
much larger than that of CO.
The comparison in the phase-space (position VS line-of-sight velocity)
indicates us that the HI gas coexisting with H![]() gas was
overestimated when the comparison is made for the column density
gas was
overestimated when the comparison is made for the column density
![]() .
H
.
H![]() gas associated with GMCs may be a small fraction of HI gas.
gas associated with GMCs may be a small fraction of HI gas.
Figure 3.6 displays the distributions of HI and CO gas.
CO and HI data are divided into
pixels whose 3D size is 40pc![]() 40pc
40pc
![]() .
The number of pixels where HI (
.
The number of pixels where HI (![]() K) and CO (
K) and CO (![]() K)
are both detected are plotted by a histogram with dark color.
While that of
K)
are both detected are plotted by a histogram with dark color.
While that of
![]() K but
K but ![]() K
(light-shade histogram) shows a different distribution.
The ratio of pixels associated with CO increases with
K
(light-shade histogram) shows a different distribution.
The ratio of pixels associated with CO increases with ![]() (Figure 3.6 bottom).
This may indicates an accretion of HI gas
to form GMCs.
(Figure 3.6 bottom).
This may indicates an accretion of HI gas
to form GMCs.
 |
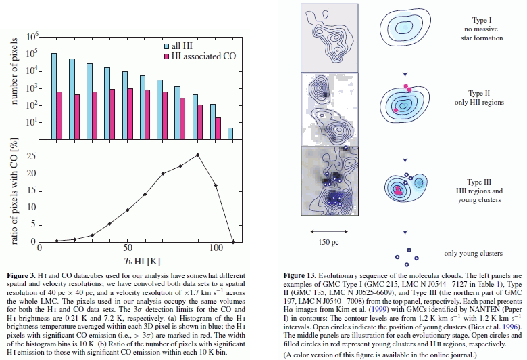 |
Another important finding of NANTEN survey is a classification of GMCs
from a stand point of massive star formation.
Kawamura et al (2009) indicate that
``Type I shows no signature of massive star formation,
Type II is associated with relatively small HII region(s),
and Type III with both HII region(s) and young stellar cluster(s),''
as shown in Figure 3.6(right).
The lifetime of a GMC through Type I to Type III is estimated
to be a few ![]() yr.
The average HI intensity for Types I, II, and III are
estimated as
yr.
The average HI intensity for Types I, II, and III are
estimated as ![]() K,
K, ![]() K, and
K, and ![]() K.
The HI intensity increases with the sequence of star formation.
K.
The HI intensity increases with the sequence of star formation.
Kohji Tomisaka 2009-12-10