


Next: Protostars
Up: Introduction
Previous: Disk Frequency
Contents
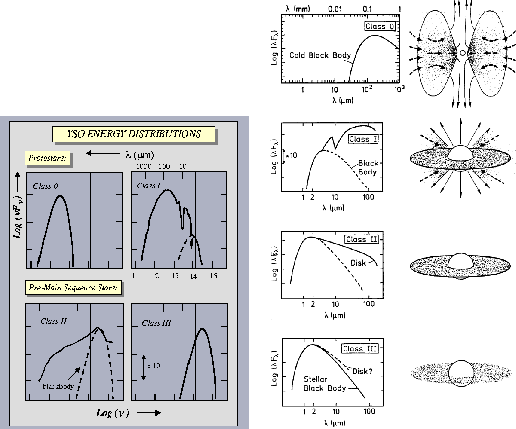
A tool to know the process of star formation is provided by the spectral energy distribution (SED)
mainly in the near- and mid-infrared light.
T Tauri stars and protostars have typical respective SEDs.
IR SEDs of T Tauri stars were classified into three as Class I, Class II, and Class III,
from a stand-point of relative importance of the radiation from a dust disk to the
stellar black-body radiation.
Today, the classification is extended to the protostars, which is precedence of the T Tauri stars,
and they are called Class 0 objects.
(Unfortunately, there is no zero in Roman numerals.)
In Figure 1.7, typical SEDs and models of emission regions are shown.
- Class III is well fitted by a black-body spectrum, which shows the energy mainly comes from
a central star.
This SED is observed in the weak-line T Tauri stars.
Although T Tauri stars show emission lines of such as the Hydrogen Balmar sequence,
the weak-line T Tauri stars do not show prominent emission lines, which indicates
the amount of gas just outside the star (this seems to be supplied by the accretion process) is small.
In this stage, a disk has been disappeared or an extremely less-massive disk is still alive.
- Class II SED is fitted by a single-temperature black-body plus excess IR emission.
This shows that there is a dust disk around a pre-main sequence star and it is heated by
the radiation from a central star.
The width of the spectrum of the disk component is much wider than that expected from
a single-temperature black-body radiation.
Thus, the disk has a temperature gradient which decreases with increasing the distance from the
central star.
In this stage, the dust disk is more massive than that of Class III sources.
Classical T Tauri stars have such SEDs.
- In Class I SED, the mid infrared radiation which seems to come from the dust envelope
is predominant over the stellar black-body radiation.
Since the stellar black-body radiation seems to escape at least partially from the dust envelope,
a relatively large solid angle is expected for a region where the dust envelope does not intervene.
- Class 0 SED seems to be emitted by an isothermal dust with
 K.
The protostar seems to be completely covered by gas and dust and is obscured with a large optical
depth by the dust envelope.
No contribution can be reached from the stellar-black body radiation.
K.
The protostar seems to be completely covered by gas and dust and is obscured with a large optical
depth by the dust envelope.
No contribution can be reached from the stellar-black body radiation.
Figure 1.7:
Spectral Energy Distribution (SED) of young stellar objects (YSOs) and their models.
(Left:)  plot taken from Lada (1999).
(Right:)
plot taken from Lada (1999).
(Right:)
 plot taken from André (1994)
 |
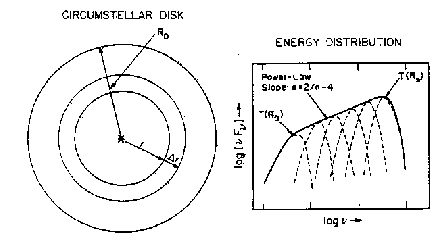
The reason why the emission from the disk becomes wide in the spectral range is understood (Fig.1.8) as follows:
Temperature of the disk is determined by a balance of heating and cooling.
Assuming the disk is geometrically thin but optically thick, the cooling per unit area is
given by the equation of the black-body Planck radiation.
Therefore, the temperature is determined by the heating predominantly by viscous heating
and extra heating by the radiation from the central star.
The flux density emitted by the disk is given by
![\begin{displaymath}
\nu F_\nu \sim \int \nu \pi B_\nu[T(r)] 2\pi r dr \sim r(T {\rm or} \nu)^2 \nu B_\nu.
\end{displaymath}](img172.png) |
(1.1) |
Assuming the radial distribution of temperature as
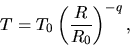 |
(1.2) |
( for the standard accretion disk)
and taking notice that each temperature in the disk radiates at a characteristic
frequency
for the standard accretion disk)
and taking notice that each temperature in the disk radiates at a characteristic
frequency  (the Wien's law for black-body radiation)
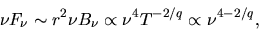 |
(1.3) |
where we used the fact that the peak value of
 .
Therefore, it is shown that
.
Therefore, it is shown that
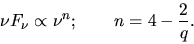 |
(1.4) |
Figure 1.8:
Explanation for the spectral index of the emission from a geometrically thin but optically thick
disk. Taken from Fig.16 of Lada (1999).
 |
As shown in the previous section, we have no young stellar objects found by IR before
a protostar is formed.
These kind of objects (pre-protostellar core) are often called Class  .
The classification was originally based on the SED and did not exactly mean an evolution sequence.
However, today YSOs are considered to evolve as the sequence of the classes:
Class
.
The classification was originally based on the SED and did not exactly mean an evolution sequence.
However, today YSOs are considered to evolve as the sequence of the classes:
Class  Class 0 Class I Class II Class III
main-sequence star.
Class 0 Class I Class II Class III
main-sequence star.
Next: Protostars
Up: Introduction
Previous: Disk Frequency
Contents
Kohji Tomisaka
2007-07-08