next up previous contents
Next: Line Width - Size Up: Introduction Previous: Density Distribution   Contents

Mass Spectrum

We have seen that a molecular cloud consists in many molecular cloud cores. For many years, there are attempts to determine the mass spectrum of the cores. From a radio molecular line survey, a mass of each cloud core is determined. Plotting a histogram number of cores against the mass, we have found that a mass spectrum can be fitted by a power law as
\begin{displaymath}
\frac{d N}{d M}=M^{n}
\end{displaymath} (1.12)

where $dN/dM$ represents the number of cores per unit mass interval. Many observation indicate that $n \sim -1.5$ as Table 1.1.

Table 1.1: Mass spectrum indicies derived with molecular line surveys.
Paper $n$ Region Mass range
Loren (1989) $-1.1$ $\rho$ Oph $10 M_\odot\mbox{\raisebox{0.3ex}{$<$}\hspace{-1.1em}
\raisebox{-0.7ex}{$\sim$}...
...ox{\raisebox{0.3ex}{$<$}\hspace{-1.1em}
\raisebox{-0.7ex}{$\sim$}} 300 M_\odot$
Stutzki & Guesten (1990) $-1.7\pm 0.15$ M17 SW ${\rm a few  }M_\odot\mbox{\raisebox{0.3ex}{$<$}\hspace{-1.1em}
\raisebox{-0....
...3ex}{$<$}\hspace{-1.1em}
\raisebox{-0.7ex}{$\sim$}} {\rm a few }10^3 M_\odot$
Lada et al (1991) $-1.6$ L1630 $M\mbox{\raisebox{0.3ex}{$>$}\hspace{-1.1em}
\raisebox{-0.7ex}{$\sim$}} 20M_\odot $
Nozawa et al (1991) $-1.7$ $\rho$ Oph North $3M_\odot\mbox{\raisebox{0.3ex}{$<$}\hspace{-1.1em}
\raisebox{-0.7ex}{$\sim$}} ...
...ox{\raisebox{0.3ex}{$<$}\hspace{-1.1em}
\raisebox{-0.7ex}{$\sim$}} 160 M_\odot$
Tatematsu et al. (1993) $-1.6 \pm 0.3$ Orion A $M \mbox{\raisebox{0.3ex}{$>$}\hspace{-1.1em}
\raisebox{-0.7ex}{$\sim$}} 50 M_\odot$
Dobashi et al (1996) $-1.6$ Cygnus $M \mbox{\raisebox{0.3ex}{$>$}\hspace{-1.1em}
\raisebox{-0.7ex}{$\sim$}} 100 M_\odot$
Onish et al (1996) $-0.9\pm 0.2$ Taurus $3 M_\odot \mbox{\raisebox{0.3ex}{$<$}\hspace{-1.1em}
\raisebox{-0.7ex}{$\sim$}...
...box{\raisebox{0.3ex}{$<$}\hspace{-1.1em}
\raisebox{-0.7ex}{$\sim$}} 80 M_\odot$
Kramer et al.(1998) $-1.6\sim -1.8$ L1457 etc$^*$ $10^{-4}M_\odot \mbox{\raisebox{0.3ex}{$<$}\hspace{-1.1em}
\raisebox{-0.7ex}{$\...
...x{\raisebox{0.3ex}{$<$}\hspace{-1.1em}
\raisebox{-0.7ex}{$\sim$}} 10^4 M_\odot$
Heithausen et al (2000) $-1.84$ MCLD123.5+24.9,Polaris Flare $M_J \mbox{\raisebox{0.3ex}{$<$}\hspace{-1.1em}
\raisebox{-0.7ex}{$\sim$}} M \mbox{\raisebox{0.3ex}{$<$}\hspace{-1.1em}
\raisebox{-0.7ex}{$\sim$}} 10 M_\odot$
Onishi et al. (2002) $-2.5$ Taurus H$^{13}$CO$^+$ $3.5 M_\odot \mbox{\raisebox{0.3ex}{$<$}\hspace{-1.1em}
\raisebox{-0.7ex}{$\sim...
...x{\raisebox{0.3ex}{$<$}\hspace{-1.1em}
\raisebox{-0.7ex}{$\sim$}} 20.1 M_\odot$
$^*$ MCLD126.6+24.5, NGC 1499 SW, Orion B South, S140, M17 SW, and NGC 7538

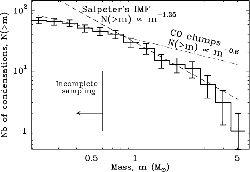
Figure 1.27: Cumulative mass distribution of the 70 pre-stellar condensations of NGC 2068/2071. The dotted and dashed lines are power-laws corresponding to the mass spectrum of CO clumps (Kramer et al. 1996) and to the IMF of Salpeter (1955), respectively. Taken from Fig.3 of Motte et al (2001).
\begin{figure}
\centering\leavevmode
\epsfxsize =.45\columnwidth \epsfbox{eps/Motte01.ps}
\end{figure}
Figure 1.27 (Motte et al 2001) shows the cumulative mass spectrum ($N(>M)$ vs. $M$) of the 70 starless condensations identified in NGC 2068/2071. The mass spectrum for the 30 condensations of the NGC 2068 sub-region is very similar in shape. The best-fit power-law is $N(>M)\propto M^{n+1}\propto M^{-1.1}$ above $M\mbox{\raisebox{0.3ex}{$>$}\hspace{-1.1em}
\raisebox{-0.7ex}{$\sim$}} 0.8M_\odot$. That is, $n=-2.1$. This power derived from the dust thermal emission is different from that derived by the radio molecular emission lines. The power $n+1=-1.1$ which is close to the Salpeter's IMF for new born stars, $N(>M_*)\propto M_*^{-1.35}$ might be meaningful. The reason of the difference is not clear. For example, Tothill et al. (2002) observed the Lagoon nebula around the edge of the HII region M8. From the continum emission $\lambda=450\mu{\rm m}, 850\mu{\rm m}, 1.3{\rm mm}$, they obtained index of $-1.7\pm 0.6$, which is consistent with other molecular line studies.
next up previous contents
Next: Line Width - Size Up: Introduction Previous: Density Distribution   Contents
Kohji Tomisaka 2007-07-08