


Next: Case Study
Up: Introduction
Previous: Introduction
Contents
Figure 1.1:
Multiphases of the interstellar medium.
The temperature and number density of gaseous objects of the interstellar medium in our Galaxy are summarized.
Originally made by Myers (1978), reconstructed by Saigo (2000).
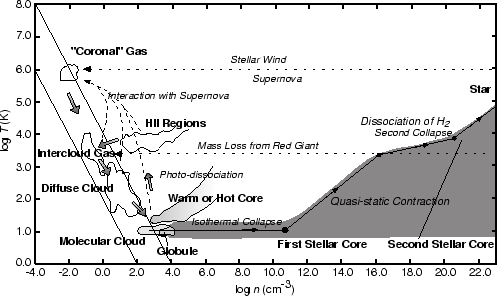 |
Figure 1.1 shows the temperature and number density of gaseous objects in our Galaxy.
Cold interstellar medium forms molecular clouds ( K) and diffuse clouds (
 K).
Warm interstellar medium
K).
Warm interstellar medium
 are thought to be pervasive
(wide-spread).
HII regions are ionized by the Ly continuum photons from the nearby early-type stars.
There are coronal (hot but tenuous) gases with
are thought to be pervasive
(wide-spread).
HII regions are ionized by the Ly continuum photons from the nearby early-type stars.
There are coronal (hot but tenuous) gases with  K in the Galaxy, which are heated by
the shock fronts of supernova remnants.
Pressures of these gases are in the range of
K in the Galaxy, which are heated by
the shock fronts of supernova remnants.
Pressures of these gases are in the range of
 ,
except for the HII regions.
This may suggest that gases are in the pressure equilibrium.
In this figure, a theoretical path from the molecular cloud core to the star is also shown.
We will see the evolution more closely in Chapter 4.
Globally, the molecular form of Hydrogen H
,
except for the HII regions.
This may suggest that gases are in the pressure equilibrium.
In this figure, a theoretical path from the molecular cloud core to the star is also shown.
We will see the evolution more closely in Chapter 4.
Globally, the molecular form of Hydrogen H is much abundant inside the Solar circle, while the atomic hydrogen H
 is more abundant than molecular H in the outer Galaxy.
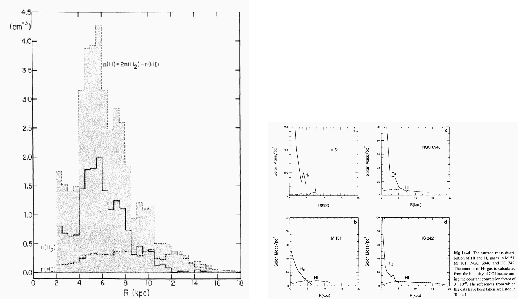
In Figure 1.2 (left), the radial distributions of molecular and atomic gases
are shown.
The right panel shows similar distributions for four typical external galaxies
(M51, M101, NGC6946, and IC342).
This indicates these distributions are similar with each other.
HI is distributed uniformly, while H density increases greatly reaching the galaxy center.
In other words, only in the region where the total (HI+H) density exceeds some critical value,
H molecules are distributed.
is more abundant than molecular H in the outer Galaxy.
In Figure 1.2 (left), the radial distributions of molecular and atomic gases
are shown.
The right panel shows similar distributions for four typical external galaxies
(M51, M101, NGC6946, and IC342).
This indicates these distributions are similar with each other.
HI is distributed uniformly, while H density increases greatly reaching the galaxy center.
In other words, only in the region where the total (HI+H) density exceeds some critical value,
H molecules are distributed.
Figure 1.2:
Radial distribution of H (solid line) and HI (dashed line) gas density. (Left:) our Galaxy.
Converting from CO antenna temperature to H column deity,
 is assumed.
Taken from Gordon & Burton (1976).
(Right:) Radial distribution of H and HI gas for external galaxies.
The conversion factor is assumed constant
is assumed.
Taken from Gordon & Burton (1976).
(Right:) Radial distribution of H and HI gas for external galaxies.
The conversion factor is assumed constant
 .
Taken from Honma et al (1995).
.
Taken from Honma et al (1995).
 |
Next: Case Study
Up: Introduction
Previous: Introduction
Contents
Kohji Tomisaka
2007-07-08