


Next: T Tauri Stars
Up: Introduction
Previous: Interstellar Matter
Contents
Figure 1.3:
(Left)  CO total column density map of the Taurus molecular
cloud (Mizuno et al 1995). Taken from their home page with URL of
http://www.a.phys.nagoya-u.ac.jp/nanten/taurus.html (in Japanese).
T Tauri stars, which are thought to be pre-main-sequence stars in the Kelvin-Helmholtz contraction stage,
are indicated by bright spots.
(Right) C
CO total column density map of the Taurus molecular
cloud (Mizuno et al 1995). Taken from their home page with URL of
http://www.a.phys.nagoya-u.ac.jp/nanten/taurus.html (in Japanese).
T Tauri stars, which are thought to be pre-main-sequence stars in the Kelvin-Helmholtz contraction stage,
are indicated by bright spots.
(Right) C O map of Heiles cloud 2 region in the Taurus molecular cloud (Onishi et al. 1996).
This shows clearly that the cloud is composed of a number of high-density regions.
O map of Heiles cloud 2 region in the Taurus molecular cloud (Onishi et al. 1996).
This shows clearly that the cloud is composed of a number of high-density regions.
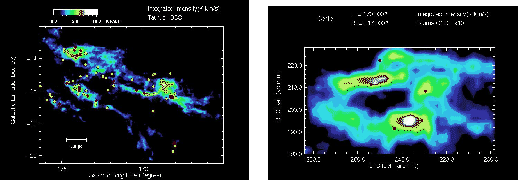 |
Figure 1.3 (left) shows the CO total column density map of the Taurus molecular
cloud (Mizuno et al 1995) whose distance is 140 pc far from the Sun.
Since CO contains C, a rare isotope of C, the abundance of CO is much smaller than
that of  CO.
Owing to the low abundance, the emission lines of CO are relatively optically thiner than that of
CO.
Using CO line, we can see deep inside of the molecular cloud.
The distributions of T Tauri stars and CO column density coincide with each other.
Since T Tauri stars are young pre-main-sequence stars with
CO.
Owing to the low abundance, the emission lines of CO are relatively optically thiner than that of
CO.
Using CO line, we can see deep inside of the molecular cloud.
The distributions of T Tauri stars and CO column density coincide with each other.
Since T Tauri stars are young pre-main-sequence stars with
 ,
which are in the Kelvin-Helmholtz contraction stage and do not reach the main-sequence Hydrogen burning stage,
it is shown that stars are newly formed in molecular clouds.
Since
,
which are in the Kelvin-Helmholtz contraction stage and do not reach the main-sequence Hydrogen burning stage,
it is shown that stars are newly formed in molecular clouds.
Since  is much more rare isotope (
 ),
the distribution of much higher-density gases is explored using CO lines.
Figure 1.3 (right) shows CO map of Heiles cloud 2 in the Taurus molecular cloud by Onishi et al (1996).
This shows us that there are many molecular cloud cores which have much higher density than the average.
Many of these molecular cloud cores are associated with IRAS sources and T Tauri stars.
It is shown that star formation occurs in the molecular cloud cores in the molecular cloud.
They found 40 such cores in the Taurus molecular cloud.
Typical size of the core is
),
the distribution of much higher-density gases is explored using CO lines.
Figure 1.3 (right) shows CO map of Heiles cloud 2 in the Taurus molecular cloud by Onishi et al (1996).
This shows us that there are many molecular cloud cores which have much higher density than the average.
Many of these molecular cloud cores are associated with IRAS sources and T Tauri stars.
It is shown that star formation occurs in the molecular cloud cores in the molecular cloud.
They found 40 such cores in the Taurus molecular cloud.
Typical size of the core is  pc and the average density of the core is as large as
 .
The mass of the CO cores is estimated as
.
The mass of the CO cores is estimated as
 .
HCO
.
HCO ions are excited only after the density is much higher than the density at which CO molecules are excited.
HCO ions are used to explore the region with higher density than that observed by CO.
Figure 1.4 shows the map of cores observed by HCO ions.
The cores shown in the lower panels are accompanied with infrared sources.
The energy source of the stellar IR radiation is thought to be maintained by the accretion energy.
That is, since the gravitational potential energy at the surface of a protostar with a radius
ions are excited only after the density is much higher than the density at which CO molecules are excited.
HCO ions are used to explore the region with higher density than that observed by CO.
Figure 1.4 shows the map of cores observed by HCO ions.
The cores shown in the lower panels are accompanied with infrared sources.
The energy source of the stellar IR radiation is thought to be maintained by the accretion energy.
That is, since the gravitational potential energy at the surface of a protostar with a radius  and a mass
  is equal to
 , the kinetic energy of the gas accreting on the stellar surface is approximately equal to
  .
The energy inflow rate owing to the accretion is
.
The energy inflow rate owing to the accretion is
 , where
 is the mass accretion rate.
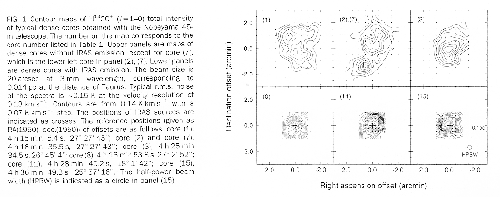
In the upper panels, the cores without IR sources are shown.
This core does not show accretion but collapse.
That is, before a protostar is formed, the core itself contract owing to the gravity, which is explained closely in chapter 4.
In Figure 1.4,
HCO total column density maps of the CO cores are shown.
Cores in the lower panels have associated IRAS sources, while
the cores in the upper panels have no IRAS sources.
Since the IRAS sources are thought to be protostars or objects in later stage,
the core seems to evolve from that without an IRAS sources to that with an IRAS source.
From this, the core with an IRAS source is called protostellar core, which means that
the cores contain protostars.
On the other hand, the core without IRAS source is called pre-protostellar core or,
in short, pre-stellar core.
Figure 1.4 shows that the prestellar cores are less dense and more extended
than the protostellar core.
This seems to suggest the density distribution around the density peak
changes between before and after the protostar formation.
is the mass accretion rate.
In the upper panels, the cores without IR sources are shown.
This core does not show accretion but collapse.
That is, before a protostar is formed, the core itself contract owing to the gravity, which is explained closely in chapter 4.
In Figure 1.4,
HCO total column density maps of the CO cores are shown.
Cores in the lower panels have associated IRAS sources, while
the cores in the upper panels have no IRAS sources.
Since the IRAS sources are thought to be protostars or objects in later stage,
the core seems to evolve from that without an IRAS sources to that with an IRAS source.
From this, the core with an IRAS source is called protostellar core, which means that
the cores contain protostars.
On the other hand, the core without IRAS source is called pre-protostellar core or,
in short, pre-stellar core.
Figure 1.4 shows that the prestellar cores are less dense and more extended
than the protostellar core.
This seems to suggest the density distribution around the density peak
changes between before and after the protostar formation.
Figure 1.4:
Pre-protostellar vs protostellar cores (HCO map).
Upper panel shows the CO cores without associated IRAS sources.
Lower panel shows the cores with IRAS sources.
Taken from Fig.1 of Mizuno et al. (1994)
 |
Next: T Tauri Stars
Up: Introduction
Previous: Interstellar Matter
Contents
Kohji Tomisaka
2007-07-08